Sunday, April 27, 2025

MYSTERIOUS WAYS & CONNECTION SELECTION

 Recently Oxford University Press published my first book written for a general readership, as opposed to a scientific research monograph. 

The description is below, and you can get it in hardcopy or E-book directly from the publisher here. You can also get it through Amazon, and a free chapter (till May 2026) here.

In one section of the book, I discuss the advantages of high connectivity in environmental systems. “Everything is connected to everything else” is called the First Law of geography, ecology, and environmental science, but why are things so highly connected? For the full answer, read the book. For an illustration of the advantages of high connectivity, I used the lower Waccamaw River, South Carolina—thus my excuse for plugging the book in the Swamp Things blog. 

Over a period of slightly less than three years, the lower Waccamaw River experienced the three highest flows ever recorded, during major floods in October 2015, October 2016, and September 2018. In 2015 an “atmospheric river” event pumped moisture from a tropical system well to the south and sent a firehose of wet air into South Carolina, causing extreme rainfall, runoff, and river flooding. Hurricanes Matthew and Florence in 2016 and 2018 included not only extreme river discharges but also storm surges from downstream estuaries. Irrespective of these large, high-energy flows (and in contrast to the severe impacts on humans and the built environment), ecological, geomorphological, and hydrological changes were minimal. The Waccamaw took a lickin’ and kept on tickin.’


Myrtle Beach Sun-News photo by Jason Lee of Waccamaw River flooding in Conway, SC on 9 October 2016. Two National Guard soldiers waded through flood waters going door to door to check on residents.  

How? Why? Because of the high connectivity among hydrogeomorphic components of the system.  Having better sense than to launch my kayak into the teeth of a hurricane, I did not directly observe what was happening in the river valley during the floods, but have made many field observations since. There is also ample aerial imagery—including some during the floods made by the U.S. Geological Survey and the National Oceanic and Atmospheric Administration specifically to assess storm and flood damage. These give a reasonable picture of what was going on at a broad scale, if not a feel for exactly how water flowed through swamps at a specific location. 

Google Earth image of part of the lower Waccamaw River.

Based on field observations and imagery, I demarcated the eight types of hydrogeomorphic elements as shown below. 


Hydrogeomorphic elements of the lower Waccamaw channel/wetland complex (copy of Table 8.2 from Mysterious Ways). 

Observed hydrologic connections and water exchanges among hydrogeomorphic elements of the lower Waccamaw River. Entries represent fluxes from the row to the column element (copy of Table 8.3 from Mysterious Ways).

Not many blank boxes, huh? There is a high degree of interconnectivity in this system, shown diagrammatically below. Almost everything is connected to almost everything else. The exchanges among elements are in all instances two-way, with the net direction of flux depending mainly on river stages and whether they are rising or falling, but also influenced by astronomical tides, local runoff, storm surges, and wind. This enabled the Waccamaw to absorb the flood and storm surge impacts by storing water and delaying flow through wetlands, activating spillways to transport excess water, reverse flows in some components, and conduct two-way exchanges of water during rising and falling river flows. 

Connectivity graph for hydrogeomorphic elements and water exchanges in the lower Waccamaw (Figure 8.6 from Mysterious Ways). 

The book gives some additional analysis, but beyond a demonstration of the benefits of connectivity, there is an important lesson about how vital it is to preserve the complex of swamps, back-channels, and other features of these lower coastal plain rivers. 

Saturday, April 26, 2025

MEANDERS & DEFLECTED TRIBUTARIES

 Did you ever notice that along winding, meandering rivers, tributary streams almost never connect on the interior, point bar section of meander bends; always on outer bends or straight reaches? Basic principles of hydrology and fluvial geomorphology regarding flow dynamics in bends readily explain why it is difficult for tributaries to form on bend interiors, and why an inner-bend location is disadvantageous, and an outer-bend site is hydraulically advantageous for tributary junctions. But these generalizations largely apply to winding rivers with channel margin bars, often sandy or gravel, that are readily mobile, and banks that are not too difficult to erode. 

Junction of Ashes Creek and the Northeast Cape Fear River, at the apex of a river meander bend. The leaves coming out of the creek show the flow dominance by the river.

But those conditions are rarely present on bends of the swamp-flanked rivers of the lower coastal plain. Both banks, including point bars on bend interiors, are typically fully and densely vegetated right up to the river’s edge. The bars are also often composed on cohesive fine-grained sediments rather than more readily moved sand. These rivers have been called “vegetation bound” by some scientists due to their perceived lateral immobility. 

In addition, these lower river reaches are characterized by coastal backwater effects as astronomical tides, wind tides, and storm surges slow, block, and reverse downstream flow. In addition, banks are also very low, and sometimes nonexistent, with just a gradual transition from open water to trees standing in water to wet, frequently inundated floodplain. 

Lower Waccamaw River, S.C.

In a nutshell, these lower coastal plain swamp rivers are quite a bit different than most alluvial rivers, and some of the generalizations about tributary junctions and meander bends may not apply. For example, on a sandy alluvial river meanders often start with a channel margin bar along what will become the bend interior. If there is a tributary junction, and if the main stream flow is significantly stronger (as it generally is), the bar will deflect tributary flow downstream. As the bend develops, the tributary is deflected toward the downstream end of the bend. If there is an incoming tributary on the outer bend, by contrast, the erosion on the cutbank shortens its channel, thereby steepening it, and promoting its staying on the outer bend. Sandy, unvegetated point bars are rare in the lowermost river reaches (fluvial-estuarine transition or tidal freshwater zones). 

From my paddling these rivers, my impression was that the pattern (tributary junctions only on outer bends or straight reaches) generally holds in these systems, especially for larger tributaries, but you can see some small channels on the low, wet, bend interiors. 

So, with some additional fieldwork and GIS analysis, I examined 121 tributary junctions along the lower reaches of seven South and North Carolina Rivers, as well as a number of other river bends that did not appear, on maps and imagery, to have tributaries.

Indeed, the no-confluences-on-inner-beds pattern holds true in these environments. None of the 121 tributary junctions occurred on bend interiors, with about half on outer bends and half on straight reaches of the main stream. The small channels occasionally found on inner bends all turned out to be local distributary/tributary channels where water flowed into the floodplain bend interior during high water and back again as river stages fall. None extended beyond the local floodplain.


A reversing (distributary/tributary) channel on the lower Neuse River. 

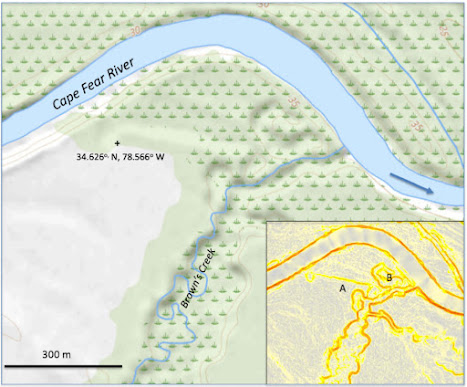
I found 17 cases where a tributary approached the interior of a meander bend on the trunk stream and turned abruptly toward the downstream end of the bend. I investigated these as possibly deflected tributaries. In six of these cases evidence was insufficient to determine whether the tributary direction changed after the river bend began developing, or the potential causes of diversion. These were cases where human alterations of terrain or drainage had occurred, or where digital elevation model data or imagery were of poor quality. All 11 other cases showed strong evidence of diversion by a similar cause. As the trunk stream bend developed, the tributary continued to occupy the original, pre-bend channel rather than maintaining its connection to the laterally migrating main channel. Or, the tributary mouth apparently migrated with the trunk stream channel for a while, and then flow was captured by a pre-bend paleochannel of the river. In either case, the tributary reconnects to the river near the downstream end of the meander bend. 

Deflected tributary on the lower Cape Fear River. 

Confluence of Bigham Branch and the lower Pee Dee River. Image on left is slope map derived from digital elevation model data. 

In this case the creek extended as the Cape Fear River bend developed, and was then captured by a paleochannel. 

One key lesson is the importance of antecedent topography in these settings. On outer bends, the pre-bend topography is eroded away as the bend develops. On inner bends it can be preserved, and this is especially the case in the study area. The dense plant cover (and often fine, cohesive soils) slow down lateral migration of the river, but allow for preservation of paleochannel features. 

Another is the local nature of gradient selection. In many cases extension of the tributary across the growing bend interior would have allowed for a shorter, overall steeper path to the river. However, flowing water can’t “see” anything but its immediate surroundings, and the remnant river channels provided a steeper, deeper, easier path at the point where they were encountered. 

This work was recently published as the article referenced below, from which the figures above came (it is open access, so you can get it for no cost). The abstract is also below.

Phillips, J.D. 2025. River meanders, tributary junctions, and antecedent morphology. Hydrology 12, 101. https://doi.org/10.3390/hydrology12050101


Tuesday, April 1, 2025

SWAMP BEAVERS

 In 1897, all native beavers (Castor canadensis) in North Carolina were gone; hunted and trapped to local extinction. In 1939, the N.C. Department of Conservation and Development got 39 beavers from Pennsylvania and released them in the Sandhills area. In 1979, after reporting on several incidents of beavers blocking drainage canals in eastern North Carolina, I wrote a column for the small daily newspaper I worked for suggesting that this was Mother Nature’s revenge for the water quality, water chemistry, and habitat damage done by artificial drainage ditches and canals in the region (it was not well received by the local agribusiness and land development establishment). By the early 1990s, scientific articles were appearing about the recovery of beaver populations in the southeastern U.S. (1).

Beaver lodges on Pinetree Creek near Vanceboro, NC (top) and on the Black River in Bladen County, NC (bottom). 

The story in South Carolina is similar—gone due to trapping and hunting by the end of the 1800s. The U.S. Fish and Wildlife Service reintroduced beavers in S.C.’s Pee Dee region in 1940. Around the same time, Georgia beavers began to recolonize the Savannah River drainage along the GA/SC border. Both populations expanded their range, according to the S.C. Department of Natural Resources, moving toward each other. Beavers are now found in all 46 S.C. counties. 

Beavers are iconic in several ways in my corners of the scientific world. Through their dam building and pond construction, they are the prototype (other than Homo sapiens, of course) ecosystem engineer—0rganisms that modify the environment to suit their own needs and affect resources and habitats for other organisms as well. They are also a prototype for the concept of the extended phenotype. An organism’s genotype is its genetic makeup, and its phenotype is how the genes are expressed in its physiology. The extended phenotype is in essence how its genes are expressed in the external environment. Beavers are also prominent in recent and ongoing efforts to use nature-based solutions in stream and wetland restoration. 

Beavers are a significant part of swamp fauna, but though their impacts are known to be significant, we don’t know a whole lot. The Classification of the Natural Communities of North Carolina (2), in the section on coastal plain floodplain forests, states:

The most poorly known natural dynamic process of floodplains is that of beavers. Beavers can dam small stream channels or may impound tributary streams or sloughs within large floodplains. Beaver ponds can raise the local water table beyond the extent of standing water. A beaver dam on an outlet slough (gut) through a natural levee can impound a large area of a complex pattern determined by microtopography. Beavers have been returning to North Carolina for several decades, after a much longer absence . . . . Little is known about their natural population dynamics, predation, disease, nor about past pond longevity and return intervals. An important question for small streams is whether all parts of a stream are suitable for pond building, so that beaver ponds appear randomly and eventually affect the whole area, or if certain favored sites are chronically ponded while others never are. In large river floodplains, only specific sites can be flooded by beaver dams; the natural levees, high ridges, and some backswamps and sloughs are not susceptible (p. 600).


Answering those questions is a tall order. Many beaver ponds in swamps are remote; you could not access them in anything other than a canoe or kayak or waders. Remote sensing experts can detect beaver dams and ponds from imagery, as a 1996 study on the Roanoke River, NC did (3). However, I looked at Google EarthTM images that spanned a period on Otter Creek in Craven County, NC before, during, and after the appearance and disappearance of a beaver dam and pond (in an area near my home where I paddle several times a year). I could not detect the emergence, presence, or loss of the feature from the images due to the complex pattern of flooding that occurs independently of any beaver ponds. 


Beaver dam and pond on upper Otter Creek, a tributary of the Neuse River estuary, The dam was not present in early 2017, and present by March, 2020. It was still there in 2022, and gone by late 2024. It is not known if the pond was abandoned, washed out by a flood, or removed by property owners. 


The classification (2) includes at least 14 different descriptions of ecological, hydrological, geomorphological, and soil transitions associated with either the establishment or drainage/abandonment of beaver ponds in the N.C. Coastal Plain alone (more are described in the Piedmont and Mountain provinces). 


A 2015 study of sediment trapping in beaver ponds included 4 coastal plain sites in Pitt County, NC and coastal plain sites in Virginia (4). On the coastal plain, they estimated that one pond per kilometer of stream length would result in 19 million cubic meters a year of deposition in the VA and NC coastal plains. They also noted that when beaver ponds are constructed on artificially channelized streams, they often restore the natural hydrological and ecological functions of the floodplain by reconnecting the channel and floodplain. 


Dam on a slough of the Black River in Bladen County, NC.


I think it likely that beavers are responsible for some of what I call water savannas or water woodland; permanently flooded floodplain depressions with mostly or entirely large, older bald cypress (Taxodium distichum) and tupelo (Nyssa biflora; N. aquatica) trees. Construction of a beaver dam floods a section of floodplain forest, and most of the trees die off (or are chewed up by beavers). Mature tupelo and cypress, however, can survive constant inundation, and while not excluded from an occasional beaver chomp (see below) are not favored. In the lower coastal plain settings where I’ve observed the water savannas, sediment inputs are very low, and abandoned beaver ponds fill in only very slowly, if at all. Tupelo and cypress remain in the ponded floodplain. This is just my proposed story, mind you, but it is plausible and fits the evidence of many of my field observations. 


A selection of water savannas & woodlands in the lower Neuse River drainage basin.


Beavers are not believed to chew on bald cypress, and I had rarely seen evidence of it before, but on Core Creek near Cove City, NC in January there was extensive evidence of chewing on cypress knees. 

 ------------------------------------------------------------------------------------


(1) Butler, D.R. 1991. The reintroduction of the beaver into the South. Southeastern Geographer 3139-43. 


(2) Shafale, M. 2023. Classification of the Natural Communities of North Carolina. Fourth Approximation. Raleigh: N.C. Natural Heritage Program. 

(3) Townsend, P.A., Butler, D.R. 1996. Patterns of landscape use by beaver on the lower Roanoke River floodplain, North Carolina. Physical Geography 17, 253-269. 

(4) Kroes, D.E., Bason, C.W. 2015. Sediment-trapping by beaver ponds in streams of the mid-Atlantic Piedmont and Coastal Plain, USA. Southeastern Naturalist 14, 577-595. 

Tuesday, March 18, 2025

How to Drown a Swamp


NASA announced recently that sea-level rose in 2024 faster than expected—and the expectation was pretty fast. To quote from their press release: “Global sea level rose faster than expected in 2024, mostly because of ocean water expanding as it warms, or thermal expansion. According to a NASA-led analysis, last year’s rate of rise was 0.23 inches (0.59 centimeters) per year, compared to the expected rate of 0.17 inches (0.43 centimeters) per year. ‘The rise we saw in 2024 was higher than we expected,’ said Josh Willis, a sea level researcher at NASA’s Jet Propulsion Laboratory in Southern California. ‘Every year is a little bit different, but what’s clear is that the ocean continues to rise, and the rate of rise is getting faster and faster.’”

Observed, estimated, and predicted rates of sea-level rise (SLR) vary geographically for any given time, and according to the emissions and climate scenarios. U.S. National Oceanographic and Atmospheric Administration (NOAA) forecasts of SLR in the Carolinas region, issued in 2022, are approximately 0.3 m by 2040 and 1.5 m by 2100, according to the Intermediate High scenario. In other scenarios, estimates are 0.26 m by 2040 and 2.17 m by 2100 (Intermediate Low), and 0.32 to 2.03 m in the High scenario. These numbers are for Wilmington, N.C.; the estimates are not too different at other forecast sites in the study region (1), but slightly faster rates are forecast for Beaufort, N.C. near Cape Lookout. One study (2) found acceleration of SLR in recent years of almost 0.05 mm yr-1 at Wilmington. Recent SLR rates in the Georgia Bight (a region stretching from the Cape Fear region in N.C. down the South Carolina and Georgia coasts and into Florida) are nearly double any previous Holocene pace, and at the current rate, they estimated water level elevations relative to the 2000 datum will be 0.46 m higher by 2050 at Wilmington.


Newport River, N.C.

So what does that mean for our beloved swamps? Swamps in the fluvial-estuarine transition zone (FETZ),sometimes called tidal freshwater forested wetlands, are hotspots for hydrological, geomorphological, and ecological responses to climate change. As sea-level rises the effects will creep upstream, with a given location gradually becoming wetter and more saline. This results in formation of ghost forests and conversion of freshwater swamps to brackish marshes at the lower end of the FETZ.

The upper end of the FETZ, defined by the upstream limit of frequent backwater effects due to lunar or wind tides or storm surges, has received much less attention. I studied these dynamics on 20 rivers from those in southeastern Virginia draining to the Albemarle Sound down to the Cape Romain/Santee River in South Carolina (3).


Kingston Lake, S.C.

First, it is important to understand that backwater effects extend well upstream of what most of us think of as the tidal portions of the rivers—an average of 71 river km (44 mi) upstream of the head of the estuary, and >100 km on several rivers. The figure below shows the sequence of events as SLR effects creep up the river valley, which are primarily occupied by frequently flooded deepwater swamps.

The backwater effects at the leading edge of upstream encroachment result in higher average river stages, which can be deduced from standard hydrodynamic equations (and from intuition and common sense). This increases the frequency and duration of floodplain inundation and raises the local water table. River hydraulic slopes and velocity are also reduced, and the backwater effects sometimes block or reverse downstream flows. This reduces sediment transport capacity.  This, plus upstream displacement of the locus of deposition (the zone of the river where the flow can no longer transport its sediment load and deposits much of it), reduces fluvial sediment inputs and floodplain deposition. This inhibits natural levee development along the banks, reducing bank heights relative to the higher water levels. These factors combine to further increase the frequency and duration of inundation, resulting in frequently or semi-permanently flooded wetlands (rather than seasonally or occasionally flooded).  

Figure 7 from (3)

Meanwhile biomass production remains high in the semipermanently flooded swamps, while anaerobic conditions associated with the increased wetness retard organic decomposition rates. Plant litter produced in situ builds up, and ponding of flood waters allows transported and suspended organic matter to settle out. This produces organic-rich surficial horizons, and eventually histic epipedons and Histosols (organic-dominated soils such as mucks and peats). Concurrently, remnants of alluvial terraces (representing floodplains formed when sea and river levels were higher) become buried by the organic alluvial soils, gradually disappearing. This burial is also affected by general valley-filling associated with SLR. Finally, vegetation changes associated with water chemistry—mainly salinity—occur, eventually followed by erosion or drowning and conversion to open water. 

These changes that occur over time during coastal submergence are evident spatially as one moves from the leading edge of effects at the upstream limit of the FETZ down to the lower FETZ adjoining the head of the estuary. Like all hydrological, geomorphological, and ecological phenomena, none of the factors is solely influenced by SLR or backwater effects, or any other single factor. Fluvial discharge, groundwater, and tidal regimes, along with local variations in antecedent topography and morphology, relative SLR or coastal submergence, human impacts, land and water use histories, and ecological variables may all affect them. 


Crabtree Swamp, S.C.

As is the case for the possibility of salt and brackish marshes to “climb” or migrate upwards in response to SLR if sedimentation is sufficient, topographic slope gradients are critical. Using a simple geometric model, we can estimate how far upstream a given amount of water level rise will extend, based on the channel slope. The figure below shows that (duh) higher rates of SLR and flatter channel slopes are associated with more rapid encroachment. The figure reflects SLR rates from less that those experienced in the 20th century to those in the higher scenarios for the rest of the 21st, and a range of slopes found in rivers of the south Atlantic coastal plain. Even the lower rates show the effects edging upstream at a rate of a few hundred meters a year. 

Figure 8 from (3)


The changes will not be visually obvious in the short run, as they chiefly involve transition from seasonally flooded to semi-permanently flooded swamps dominated by many of the same plant species. These leading-edge transitions also occur on sections of the river that are undeveloped, not widely used, and that lack gaging stations or other regular monitoring. Transitions at the lower end are more evident, as swamps turn to ghost forests to marshes—such changes are evident on some rivers from a couple of decades worth of Google EarthTM images. The changes in between are also relatively subtle over time frames of a few years, particularly when any ongoing trends are overprinted with month-to-month and year-to-year variations, along with the effects of storm and flood events. 


Implications of these changes are poorly understood, other than that they will be important. Effects of the upstream movement of the fluvial-coastal interface include water chemistry (especially salinity, conductivity, and sulfate reduction in wetlands), hydraulic slope gradients (influencing sediment transport and deposition), net flow directions and velocities, and frequency of overbank flow. Impacts on channel and floodplain morphology include bank height, channel cross-section and planform morphology, the formation and abandonment of subchannels and anabranches, watershed fragmentation, crevasse and avulsion dynamics, and floodplain sediment storage.

_____________________________________________


            (1) NOAA Sea Level Rise Viewer: https://coast.noaa.gov/slr/

(2) Houston, J.R. 2021. Sea-level acceleration: Analysis of the world’s high-quality tide gages. J. Coast. Res. 37, 272-279.

       (3) Phillips, J.D. 2024. Sequential changes in coastal plain rivers affected by rising sea-level. Hydrology 11, 124.


Sunday, March 9, 2025

Bank Failure & Cypress Success

 One of the most fascinating things about bald cypress, water tupelo, and swamp tupelo trees (Taxodium distichum, Nyssa aquatica, N. biflora) is that they have very specific conditions for their natural dispersal, germination, and establishment. Because of this, where the trees are established tells a story about conditions at the times the trees got started. Certainly, this is of intrinsic botanical and ecological interest, but it also provides evidence of hydrological and geomorphological conditions, and in some cases, changes.

The seeds are dispersed mainly by water. To germinate, they need to be deposit on wet 


A mass of floating water tupelo seeds on the floodplain of the Pee Dee River, S.C.

or at least moist soil. They cannot germinate underwater, and seedlings must grow tall enough to rise above any subsequent flooding. Once that happens, the trees can survive in perpetually inundated conditions, but the spot where establishment occurs must have been subaerially exposed—wet maybe, but not underwater—for at least one growing season. One of the things that particularly interests me is cases where tupelo and cypress are growing in sites that are always underwater. They can’t have been that way when the trees got started, so something changed. For example, the Google EarthTM image below shows a 0.5 km (0.3 mile) stretch of the shoreline of the Chowan River, N.C. 

Cypress trees growing in standing water, Chowan River. 

Here cypress and a few tupelo are growing in always-flooded conditions because shoreline erosion and drowning by rising sea-level has overcome the sites where the trees germinated. You can measure and see that >100 m of shoreline retreat has occurred over the lifetime of the oldest, farthest from the modern bank trees. 

But there are cases where trees are growing in constantly inundated conditions where it is not obvious how they ever dried out long enough for trees to establish, or how once exposed sites got drowned. Again, the tree survival and growth is no surprise—cypress and tupelo can do that—but they cannot have gotten started underwater. 

Trees growing in constantly flooded conditions along the Trent River, NC. 

Where this occurs, one of several things must have happened—an extreme drought or diversion of flow away from the site long enough for trees to germinate, perhaps, or channel changes that leave a non-flooded depression that is later filled. Or, the trees germinated on a higher spot, which could have been a log or stump from a predecessor that died. This blog will investigate more of these situations in, as they say, the fullness of time.

The situation I address now is that of trees growing along, but away from, a distinct bank (in these swamps a distinct bank is not always present—many banks are very low, or even absent, with just a gradual transition from open water to deepwater swamp). Like the example above, the trees could have started on a stream bank which later eroded, and some of them probably did. But in other cases, the field evidence makes that unlikely, and therefore a puzzle. 


Trees in perpetually flooded sites along the banks of Cedar Creek, SC (top), and Tar River, NC (bottom).

Then last week, I was paddling along Holly Shelter Creek (tributary to the Northeast Cape Fear River), and I noticed something that I should have noticed a long time before—bank failures. Slumps, slides, and rotational failures along banks can dump sediment along the stream edge where a tupelo or cypress could get established before the failure material gets washed away.

A line of tupelo and cypress of apparently similar age along a section of Holly Shelter Creek that has experienced a series of bank failures. 

Older cypress resprouting from stump—note the slump scar on the bank behind it. 

Slump scars along the Trent River.

Slump sites along Island Creek, NC. 

I feel a bit foolish for not thinking of this before, because I’ve seen more than one example like the one below, which I photographed in 2012. The slump does not have to have trees already growing on it, however—in fact, unless such trees are hydrophytes such as cypress, tupelo, some willows, etc., they won’t last long with their bases underwater. All they must do is provide a substrate that stays mostly above water for a growing season.

Bank slump along the Sabine River, Louisiana. 


Monday, March 3, 2025

Fire in the Swamplands

When I went out this morning (in Myrtle Beach, SC), it looked as though a heavy fog had settled in. My eyes began to itch, and my nose quickly confirmed that the fog was actually smoke. Horry County, parts of it at least, is burning. Night before last, my son’s family had to evacuate their neighborhood (the upside was that we got some extra grandkid time, because we all crowded into our apartment for the night). 

Fire in the Carolina Forest area of Myrtle Beach

 (photo by Horry County Fire & Rescue). 


As dangerous and inconvenient and costly as it is, this does not compare to many of the recent fires in the western U.S. But what makes it relevant to the Swamp Things blog is that much of what has been burned or is burning is forested wetlands. While wetlands do occasionally dry out and burn, you don’t really associate fire and wet areas. But that is increasingly going to change. 


National Wetland Inventory (NWI) map for a portion of the Carolina Forest area recently and currently burning. The green areas are mapped wetlands; at the bottom of the figure, you can see roads from the ever-expanding subdivisions in the area. The NWI codes including “FO” are forested wetlands. The areas shown are mostly classified as seasonally flooded. 


Climate attribution studies have identified the climate change drivers of increased fire frequency and severity in the west (and elsewhere). Though it is too soon to make that call for the South Carolina fires burning now, it is a good bet that more and bigger fires due to climate change are in the cards for the southeastern U.S. (if you doubt that climate change is happening, you are in the wrong blog, friend). Take a look at the figure below, produced using the U.S. Geological Survey National Climate Change Viewer . The tool uses outputs of 23 different climate models from 17 different sources or agencies. For this graphic the multi-model mean predictions were used. The viewer displays results for six different scenarios. In this case results for scenarios of 1.5, and 3o C warming were used. Changes are evaluated relative to a 1981-2010 baseline for three different periods: 2025-2049; 2050-2074; and 2075-2100. The figure below is for the Pee Dee River basin, but generally similar results show up if you analyze other areas of the region. Of course, temperatures will generally increase but so will (on average) precipitation. But what’s important for fire regimes is the balance between precipitation and evapotranspiration, which shows up in total runoff, soil moisture, and evaporation deficits (reflecting the difference between how much plant water use and evaporation would occur if moisture is always available, versus how much will actually occur). 


Month-by-month predictions for the Pee Dee River watershed (South and North Carolina) under 1.5 and 3 degree C warming scenarios (the +1.5 is basically already upon us) reflecting the net balance between precipitation inputs and evapotranspiration outputs. The solid line represents the 1981-2010 mean; the predicted values (with error bars) indicate the deviations.


As you can see, it will almost certainly get drier, making droughts more likely. And more drought means more fire. 


Some current outputs from the U.S. Wildland Fire Assessment System showing the dry conditions in northeastern South Carolina and the high fire risk. 


Fire swamps


For many of us of the nerd persuasion, the term “fire swamp” conjures up scenes from the classic movie ThePrincess Bride, where the fire swamp produces not only frequent and unpredictable jets of flame, but is also the home of the notorious ROUS (Rodents Of Unusual Size). But, given that seasonally flooded and hydrologically isolated wetlands can and do burn (for instance, peat fires in the pocosin shrub bog wetlands of the Carolinas are not uncommon during dry periods), what about the deepwater swamps I am mainly concerned with in this blog? These are by their nature not prone to frequent fire and are by no means fire-adapted or even fire-dependent ecosystems like some others hereabouts (for instance, longleaf pine woodlands and savannas). 


Bald cypress (Taxodium distichum), swamp tupelo (Nyssa aquatica) and water tupelo (N. aquatica) are the iconic swamp trees. All have low to very low fire resistance. However, though fire is rare, it can be important in maintaining bald cypress dominance by reducing competition from broadleaf trees. Surprisingly, Atlantic and Gulf coastal plain floodplain and riparian communities have fire return intervals of 9 to 69 years, according to the LANDFIRE model of the U.S. Forest Service, 52 to 90 percent rated as low severity (1).


The upshot is that while our beloved swamps on hardly on the front lines of these particular impacts of climate change (as opposed to changes in storm frequency and severity and sea level rise), they are not immune—as the smoke in my eyes when I go outside reminds me. 


Some video of the Carolina Forest Fire, from resident Greg Staff, via the Myrtle Beach Sun-News. 

___________________________

(1) Fire Sciences Laboratory, 2012. Information from LANDFIRE on fire regimes of Gulf and Atlantic coastal riparian and floodplain communities. In: Fire Effects Information System, U.S. Department of Agriculture, Forest Service, Rocky Mountain Research Station, Missoula Fire Sciences Laboratory (Producer). Available: www.fs.usda.gov/database/feis/fire_regimes/Gulf_Atlantic_coast_riparian/all.html.

HOW LOW CAN IT GO?

 Usually in swamp paddling adventures I prefer high water, even floods. That gives me a better look at where all the water is going, and exc...